
Assessing Asymmetries with Movement Maps
Part 2: When the Lab Doesn’t Cut It Anymore
Continued from Part 1
Have you ever heard of the Hawthorne Effect? You should Google this term. It refers to the effects of taking a measurement on what we actually want to measure. Imagine you are a sociologist interested in the sexual behaviours of middle-aged men. How effective would it be to park your lab equipment in the bedroom of your study participants to understand what really happens? That’s the Hawthorne effect. The Hawthorne effect also impacts neuromuscular testing.
Suppose I want to assess interlimb asymmetries in change of direction movements like making a cut on the field. I bring my athlete into my biomechanics lab, place several markers on their body and have them perform the test. I need to instruct them to hit the force plate each trial so that I can get a valid measurement. The act of measuring has now impacted what I want to measure because of the constraints of the data collection methodology. The act of measuring has changed how the athlete moves.
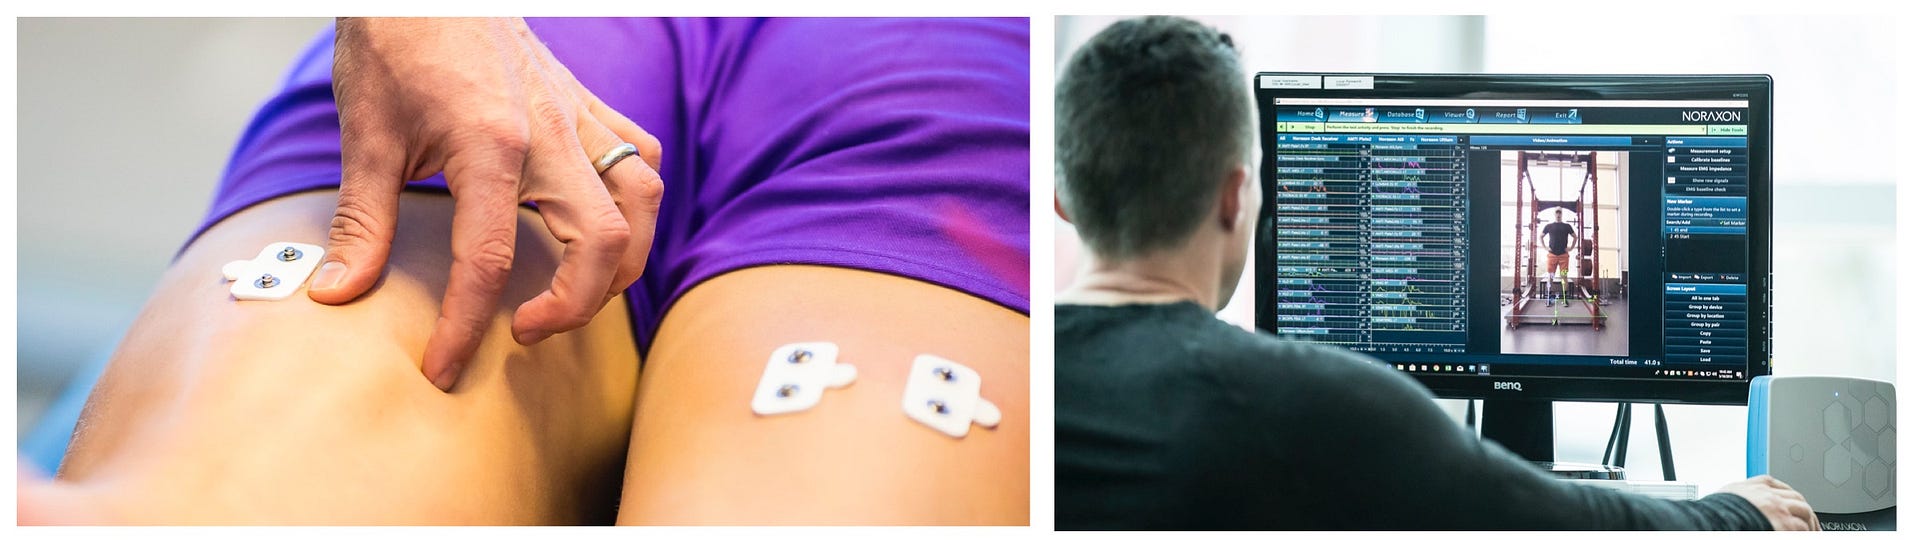
Photo Dave Holland, Canadian Sport Institute Calgary
This example suggests the importance of bringing the laboratory to the athletes or taking a living lab approach to research. In a living lab, researchers aim to minimize the impact of their measurements on the constructs they are assessing. We might try to do this by bringing our force plates on the road with us or setting up in the weight room. But we are limited to testing just a handful of movements with a dual force plate system (e.g. jumping and squatting).
We are also unable to measure where it matters most, on the field of play. Think about a professional football player with an ACLR who is running for his life in training camp as 300 lbs defensive linemen chase him down. Does a vertical jump asymmetry test tell us the whole picture? Do you think it would be important to identify compensation patterns when he is avoiding tackles? What about capturing this information when he is fatigued or as he progresses (or regresses) through training camp?
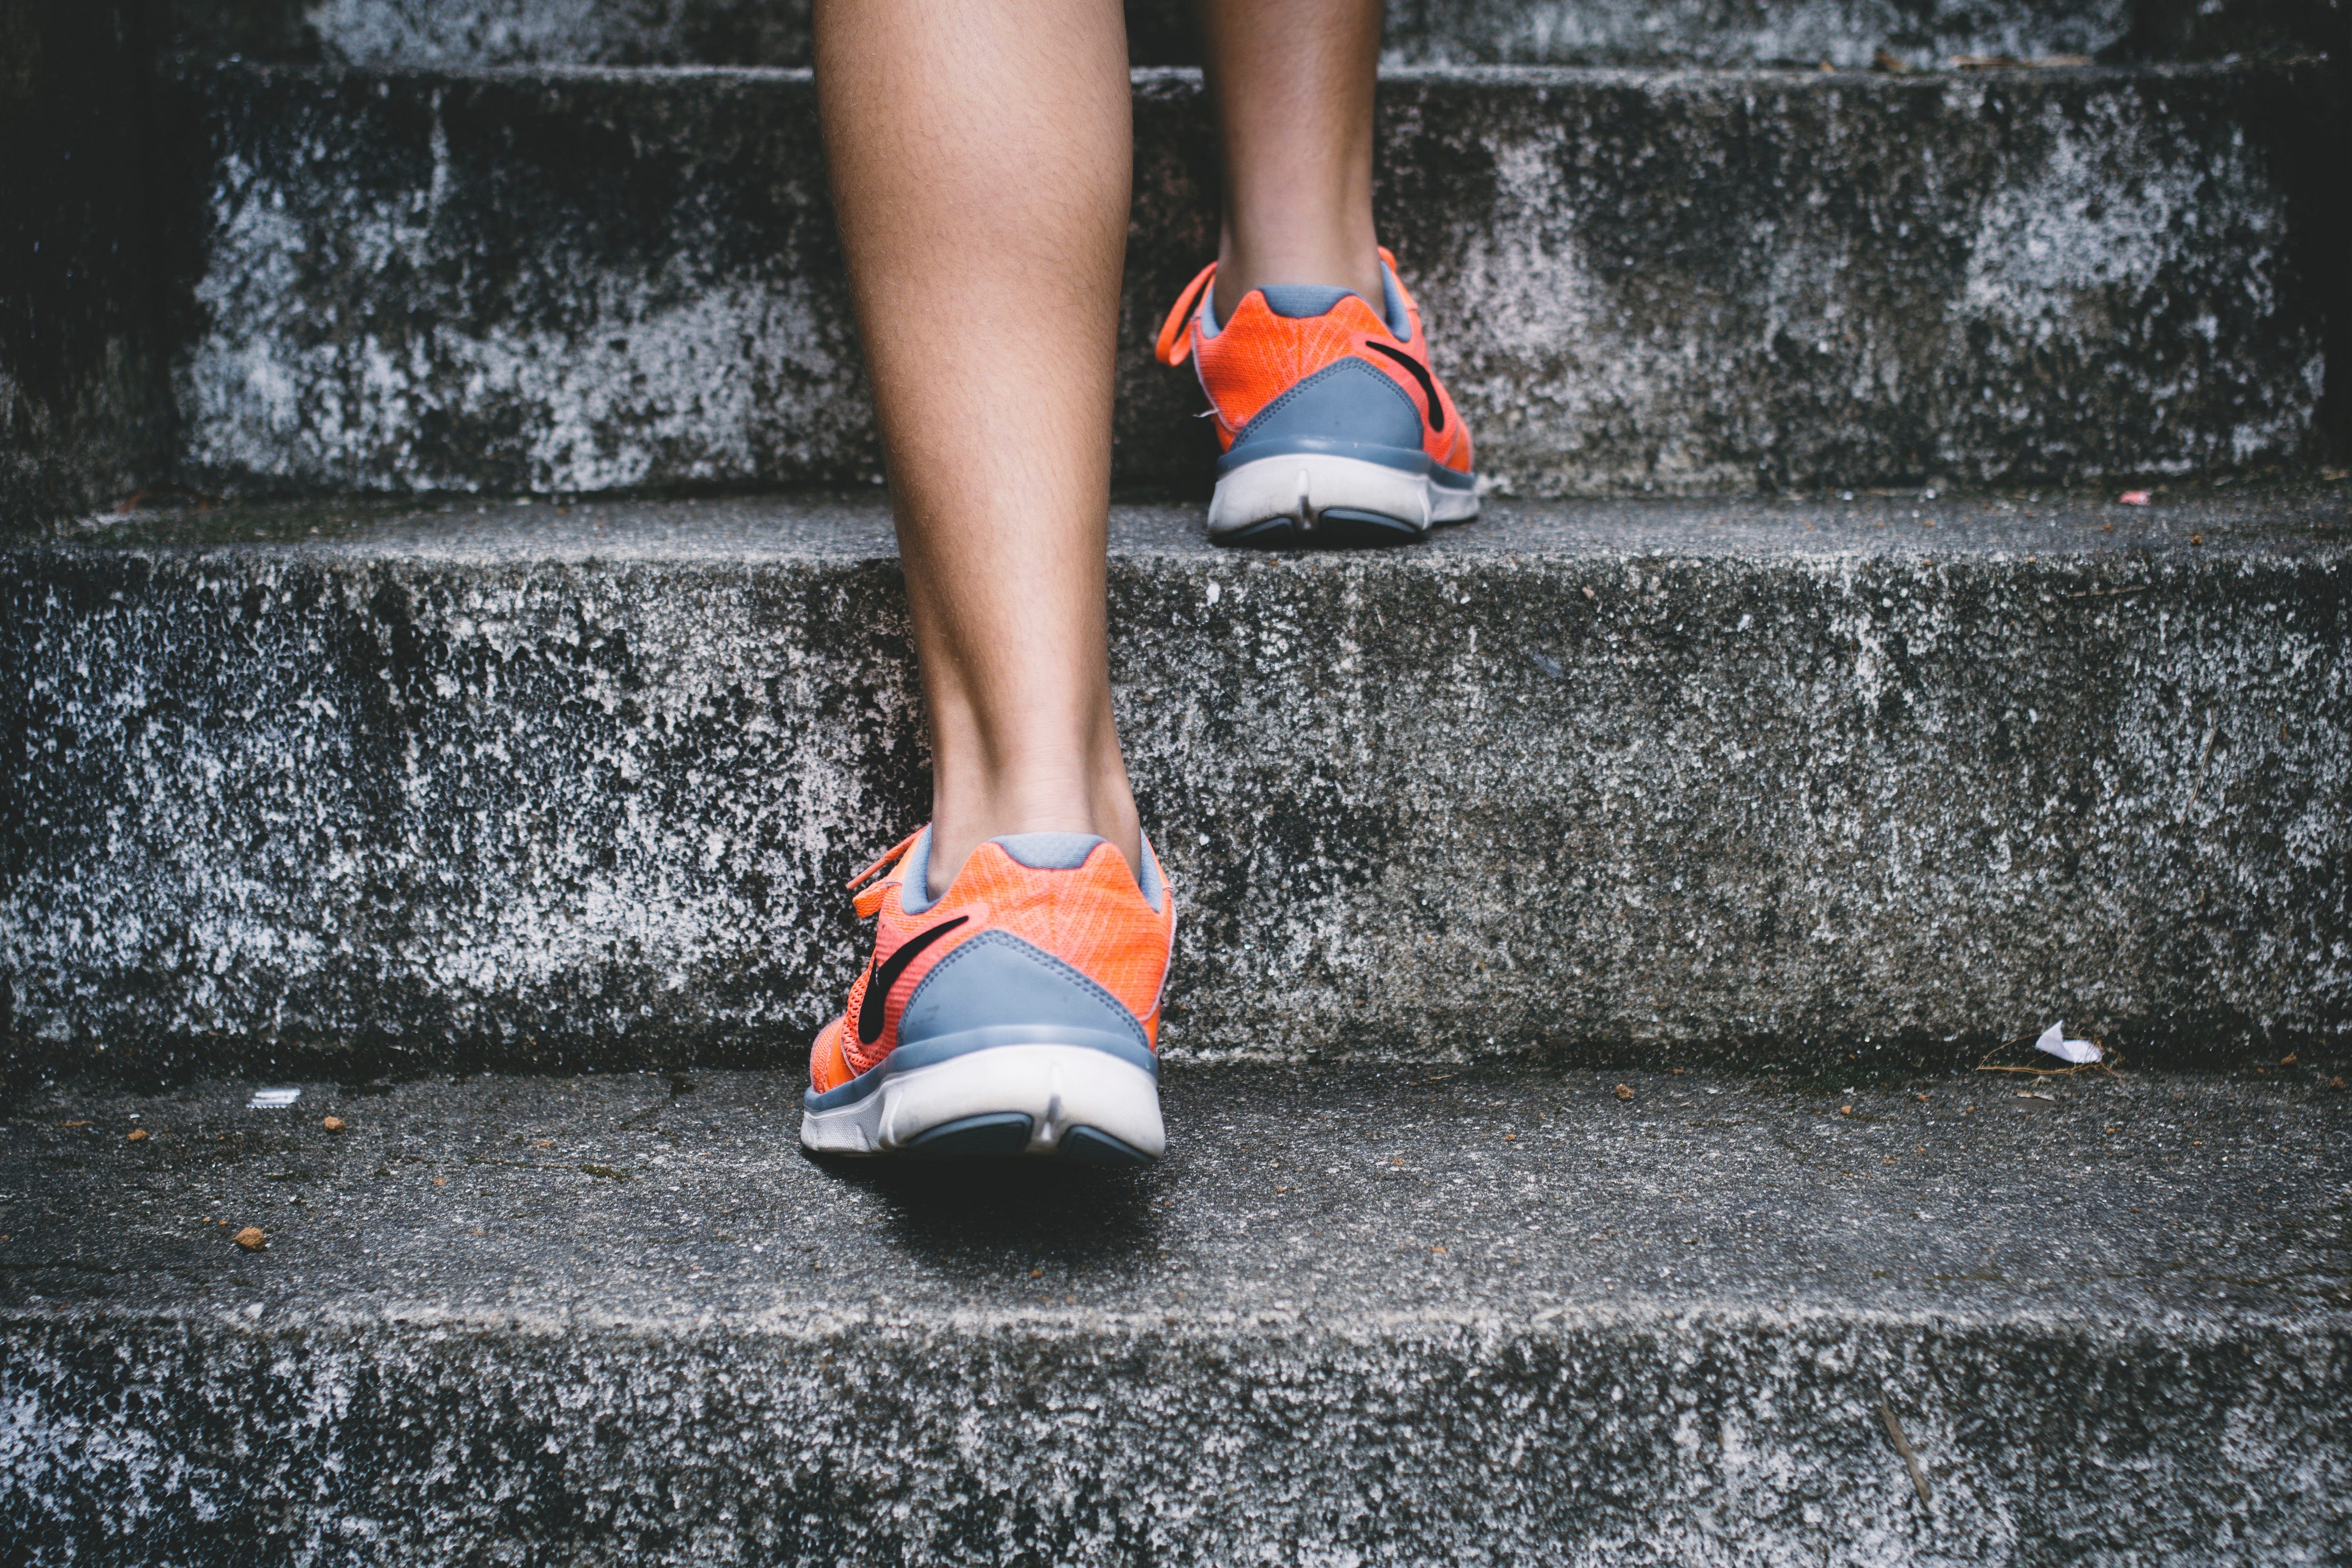
Image from pixbay.com
Movement asymmetries are also different from strength asymmetries. With a strength asymmetry, we typically measure the maximal strength of one limb compared to the other. Variability in the signal challenges the repeatability of our measures. Movement asymmetries are more variable than strength asymmetries and movement variability is not unwanted. In fact, variability contains critically important information.
Movement variability has a sweet spot, sort of like Goldilocks and the three bowls of porridge. One bowl is too hot, one is too cold, and one is just right. Similarly, too much and too little movement variability can indicate an underlying problem. Our tests (at least some of our tests) need to capture the complexity movement and the sport environment itself. Rather than trying to mimic this in the laboratory, the best approach is to test athletes on the field of play.
Where wearables work
The challenges around laboratory-based testing opens the door for wearable technologies that detect deficits in injured athletes on the field of play, on the ice, on the snow or on the court. Wearable technologies also allow us to quantify the complexities of different types of human movements like walking, running and jumping. Similar to assessing interlimb asymmetries with a dual force plate system, we evaluate asymmetries and movement quality using wearable technology in an unobtrusive manner.
You may be thinking that a simple walk test couldn’t possibly capture relevant information about the health an elite athlete with ACLR beyond the early phases of rehabilitation. But our health is reflected in how we move, and this is what makes a walk test extremely informative. Plantiga artificial intelligence algorithms can currently predict when an ACLR surgery occurred within a few weeks from a walk test. Imagine being able to track the progression/regression of an athlete after an ACL injury by tracking them walking into a training facility. A mundane task of daily living is transformed into a sophisticated diagnostic tool.
The key success factor for using artificial intelligence to drive health and performance insights is getting high fidelity data. The Plantiga insoles provide high fidelity data because of the placement of the sensor under the foot. Placing electrodes under the foot makes intuitive sense because it lends itself towards a direct measurement of interlimb asymmetries.
Many wearable technologies try to identify gait asymmetries using sensors placed remotely, like between the shoulder blades. However, the efficacy of this approach has been questioned in the scientific literature. With time synchronized sensors under each foot, we can obtain a direct measure of lower limb asymmetry. The second advantage of the sensor location is a reduction in movement artefacts that are often found when sensors are attached remotely on the body. We can also pinpoint important events in walking and running based on the high-quality signal.
I was astounded when I first saw the lower limb movement patterns that emerged from a simple walk and run test. These patterns reveal all sorts of information about the functional status of an ACLR individual. Consider the movement asymmetry maps shown below. The maps depict individuals with different functional statuses. The green map belongs to a healthy individual performing a routine run test and the red maps belong to individuals performing their first run tests following injury. The different patterns are evident to the naked eye, but it is only through machine learning that we can extract insights.
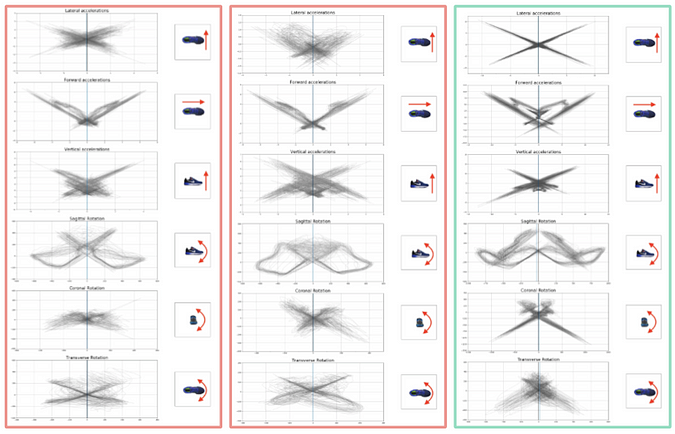
1 minute run movement maps for injured (red) and healthy (green) individuals.
The power of artificial intelligence is that predictive insights only get better as more data is collected. Artificial intelligence also allows us to move beyond conventional testing methodologies that confine us to assessing a single activity at a time as movement detection can be automated. The tester doesn’t have to indicate whether or not the player is walking, running, jumping or changing direction because the algorithm can identify this automatically. The possibility for transforming every practice, game or walk to and from the parking lot into a functional assessment opportunity is coming rapidly.
I started my journey trying to bring science into the weight room. I struggled greatly. Interlimb asymmetry testing with a dual force plate system changed everything for me and expanded what I brought to a performance conversation, especially for athletes after lower body injury. It was also conducive for athlete baselining and monitoring, a key concept for improving the quality of our exercise interventions and training recommendations for injured and noninjured athletes. We have to understand how athletes are changing first to determine why they are changing and how to make it better.
But the blind spot was still there. I could not pinpoint how athletes coped on the field of play where it mattered most. What I’m most excited about is that the day is finally here. A practical wearable technology solution that intuitively places two sensors under each foot inside normal footwear can mimic a dual force plate system by providing a surrogate measure for interlimb force-time asymmetries. More excitingly though are the possibilities that arise from artificial-intelligence-backed algorithms that pull patterns from the data, driving new insights and predictive power. Our health is expressed in how we move, and the blinders are about to literally come off.