
Sherlock Holmes, Heuristics, AI, and Plantiga: Part IV

This is the final blog post in a four-part series on the Plantiga system and how it can help the individual patient, the athlete, the weekend warrior, the clinician, and the performance practitioner generate their own objective measures to optimize their health and manage recovery after injury.

Musculoskeletal (MSK) injuries like broken bones, torn ligaments, and ruptured muscles change how we move, reduce our muscle strength and power, and cause us to compensate in ways that increase our risk for a second injury down the road.
To mitigate this risk, the science tells us that we should move beyond our instincts and measure our movement to pinpoint trainable deficits, using a criteria-based approach to determine our readiness to return to a high-risk activity.
In the last blog post, we talked about the importance of the n=1 approach to rehabilitation. As the post-injury recovery period may unfold differently depending on the person’s age, training history, recovery capacity, and sport, we need to measure the things that matter to guide this process.

A practitioner’s guide to a hierarchy of evidence for guiding the return to sport functional milestone road map.
We also showed how Plantiga can measure movement and provide practitioners with a data-led approach to rehab. Plantiga allows practitioners to measure walking, running, change of direction, and jumping movements. It gives a high-fidelity assessment of individual movement, allowing practitioners to pinpoint where potential deficits are lingering.
In this blog post, I will cover some thoughts on monitoring rehabilitation after an anterior cruciate ligament (ACL) injury and I will also provide an overview of my favourite Plantiga tests.
Move Beyond the Practitioner “Eye” after ACL Injury
There is limited evidence supporting a direct association between common return to sport testing protocols and outcomes after sport-related injuries like ACL tears (Paterno, Huang, Thomas, Hewett, & Schmitt, 2017; Webster & Hewett, 2019). Common tests like the single leg hop for distance, triple hop, and timed hop have low predictive validity for reinjury, probably because they fail to detect movement compensation patterns.
One thing is certain though. It is clear that practitioners have to move beyond simple “visual inspection” and timelines to determine when an athlete is ready to return to a high risk activity (Mørtvedt, Krosshaug, Bahr, & Petushek, 2020).
One of the biggest prospective studies to date looking at risk factors for ACL reinjury in an athletic population found predictors of future injury (King et al., 2021). Here, individuals who went on to suffer an ACL reinjury displayed lower plyometric ability or reactive strength, lower quadriceps strength, and altered movement patterns during change of direction movements compared to those who did not.
My Favourite Plantiga Rehab Metrics after ACL Injury
The Reactive Strength Index (RSI): What it Is, and Why You Need It!
Reactive strength is an assessment of a coupled eccentric-concentric movement called a stretch shorten cycle (SSC). SSCs occur readily in all sorts of movements, enhancing our maximal muscle power, and, based on new research, predicting who might be at risk for a future ACL reinjury.
Reactive strength can be measured using the reactive strength index (RSI) that is calculated as flight time (or jump height) divided by the jump contraction time (or ground contact time) during a vertical jumping movement (Figure 2). Plantiga measures this in all sorts of jumping movements.
In lay terms, imagine the stiff suspension of an Audi S4 compared to the soft suspension of a 1980’s Cadillac. The work done by King et al. (2021) showed that the “suspension” in athletes with ACL injury who went on to suffer a second ACL injury was more like the Cadillac whereas the individuals who fared well had the suspension of an Audi S4.
Despite its popularity in sport performance, RSI is less known in clinical sports medicine, but if there is one thing to add to your post-injury test battery, it’s RSI.

The Reactive Strength Index
Through our research, we have also found that RSI is often lower in ACL injured athletes and in young development level athletes in extreme winter slope sports, like alpine ski racing.

The reactive strength index (RSI) measured in ACL injured, elite controls, and developmental level alpine ski racers.
The important thing for practitioners is that reactive strength is trainable, meaning that once we know a deficit is present, we can address it through targeted training. RSI is easy to measure with Plantiga and it is right at the top of my list of critical metrics.
Between-Limb Asymmetry in Walking, Running, and Jumping
In blog post III, I noted some of the limitations with measuring between-limb asymmetry. Notably, having two symmetrical but relatively weak limbs is not that helpful after injury. In fact, we would probably prefer to be strong and asymmetrical.
We also know that an ACL injury can lead to impairments in strength for the non-injured limb, and oftentimes, a contralateral ACL injury is more likely than a reinjury to the previously injured limb.
But assuming we have two strong limbs, the Plantiga between-limb asymmetry index is a great way to monitor rehab after ACL injury and we can assess this across a whole range of measures. The figure below shows the recovery in between-limb asymmetry for a few running measures in 3 athletes returning from ACL injury. A positive number reflects non-injured limb dominance, and a negative number reflects injured limb dominance. .

Recovery in between-limb asymmetry in running for ground contact time (GCT), impact acceleration at foot strike (impact_force), stride length, and stride time for 3 athletes with ACL injury across the post-injury recovery period.
We can see how the between-limb asymmetry index reduces over time by looking at the blue trend line. Also, these data shown above reflect an older algorithm. Check out some of the features in the next section using the new and improved GRIN (GRound INteraction) machine learning algorithm, shown in the next figure.
The New and Improved GRIN Algorithm Unlocks Full Potential for Foot-Ground Interaction
The images shown below below are pulled directly from the Plantiga web app. Plantiga’s GRIN algorithm detects when the foot is on and off the ground. The new GRIN algorithm has unlocked a whole bunch of granular foot-ground-interaction measures that are massively helpful during rehabilitation.
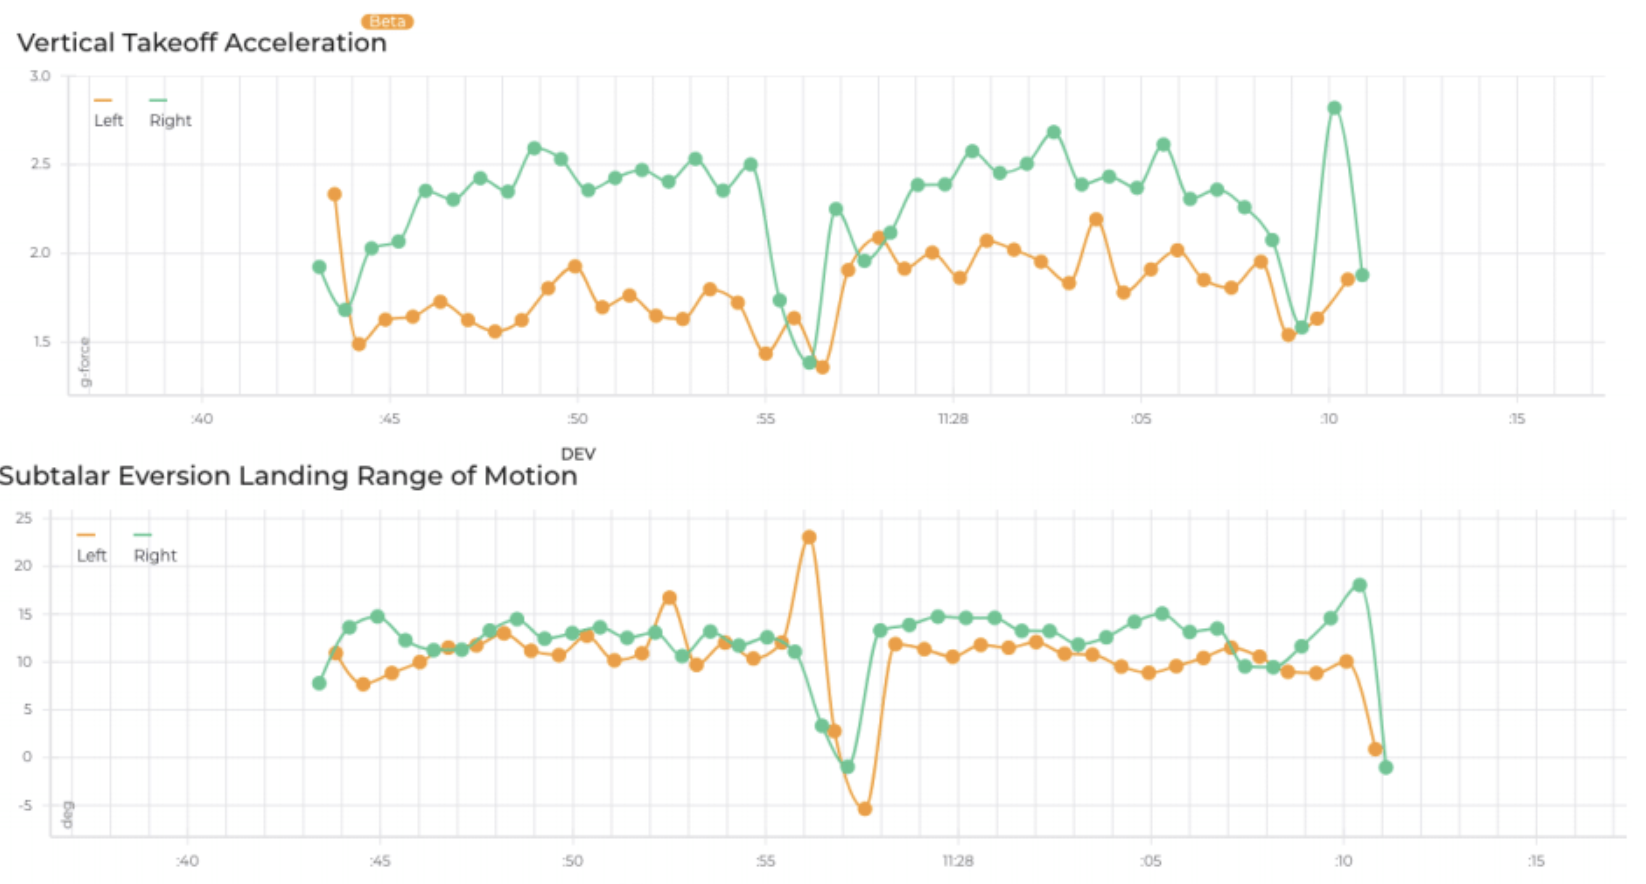
Vertical takeoff (push-off) acceleration and subtalar eversion range of motion in an athlete with a previous left-side injury.
The figure above shows the potential for practitioners to measure all sorts of biomechanical variables like you would with a $100,000 motion capture system that would require an hour of data processing.
The athlete shown above did a simple out and back run in a clinic. Here, we are showing pronounced between-limb asymmetry in the vertical takeoff acceleration associated with propulsion and decreased subtalar eversion range of motion. Practitioners can use these data to pinpoint where problems are happening in all kinds of movements and then develop tailored rehabilitation plans to address the gaps.
Norman the AI Provides Insights Based on How you Move
The final feature that really has me excited about Plantiga is the movement quality score that is based on a simple 2-minute walk test.
Norman is named after Quin Sandler’s late father, who co-founded the company with him. The plan has always been to use Plantiga to provide AI driven insights into health and performance, and now a 2-minute walk test can predict movement quality in individuals with ACL injury. The figure below shows the movement maps for 2 individuals, one with a large impact acceleration asymmetry in walking and the other with a normal gait pattern.
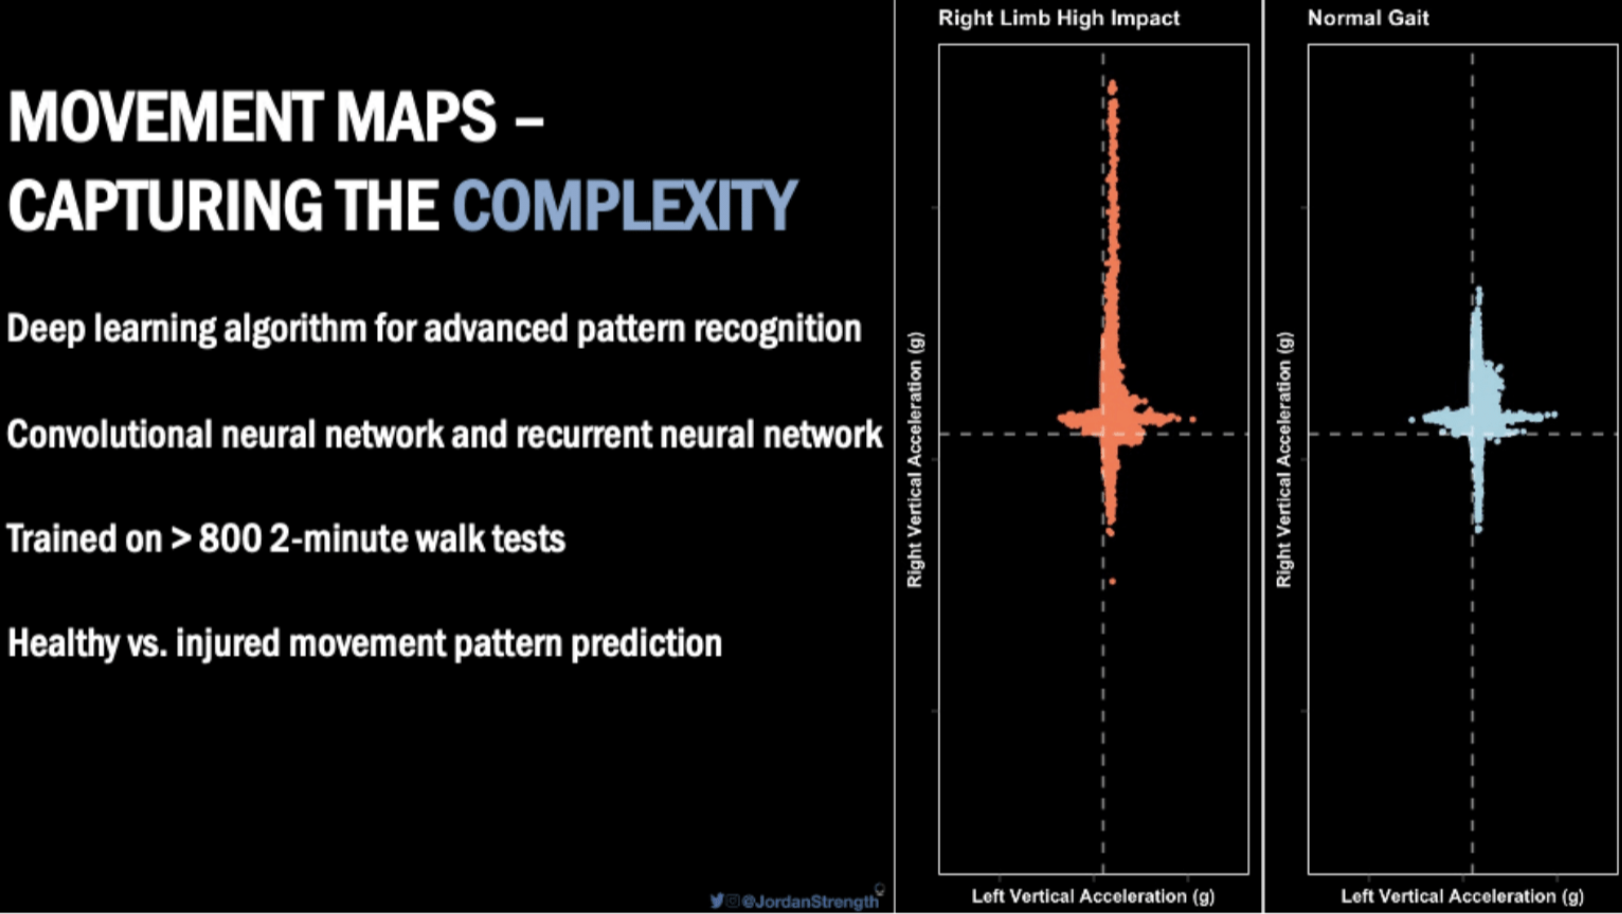
Figure 7: Capturing movement complexity with Plantiga
Norman the AI captures the full complexity of how we move. You can obtain images of this complexity in a cool feature on Plantiga’s platform called Movement Mapping.
Subsequently, the Plantiga crew collected data on ACL injured and non-injured participants to look at their movement quality in walking and used the time-from-surgery to teach the AI to recognize movement impairments.
Now, Plantiga will make a prediction to say whether your movement patterns look like a non-injured person (a score of 5) or someone with a recent ACL reconstruction surgery (a score of 1).
Check out how well the Plantiga system did on unseen data – this means that after training the AI, Norman was shown a bunch of individuals it had never seen before, including those with and without ACL injury, and it analyzed the walking patterns and made a prediction about whether the individual was looking like they recently had an ACL reconstruction on one end, or was non-injured on the other. See the results below.

Predictions from Norman the AI based on a simple two-minute walk test. A score of 1 means the movement pattern looks a lot like someone who recently had an ACL reconstruction and a score of 5 means the movement pattern looks a lot like a non-injured individual.
Summary
Finally, there is a tool that practitioners and individuals can use to help improve human movement. The future is here.